Hydroponic Dashboard
To create a dashboard for the hydroponic system I used Mycodo, an open-source environmental monitoring and regulation system. Mycodo runs on the Raspberry Pi and uses a web user interface as the front end
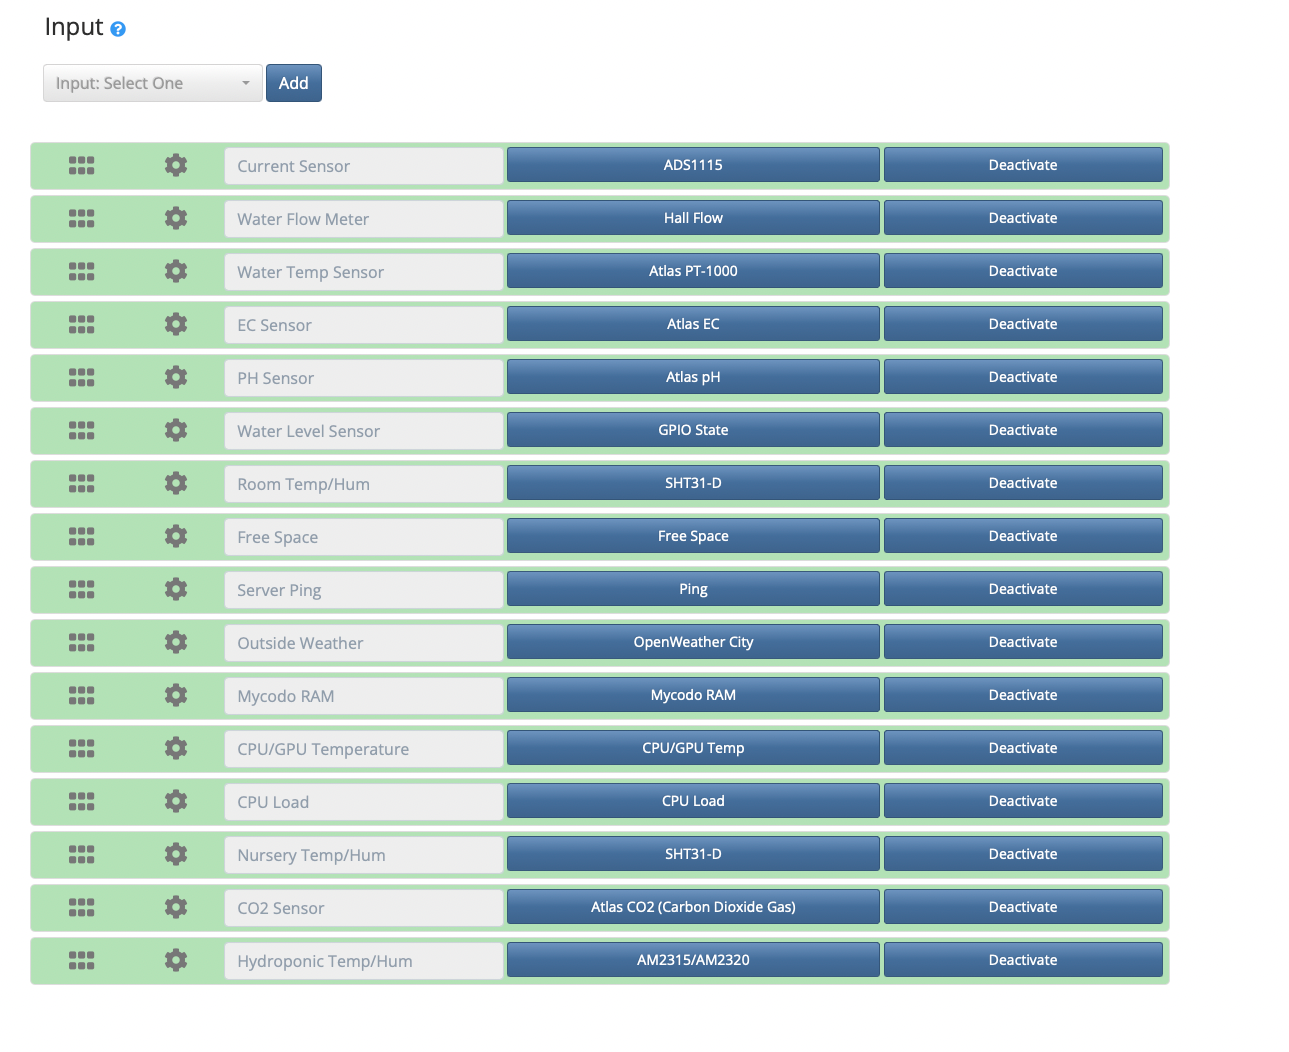
The first step was adding the inputs. My inputs included my hydroponic sensors, an API to check the outside weather, and information about the Raspberry Pi such as RAM usage or CPU temperature.
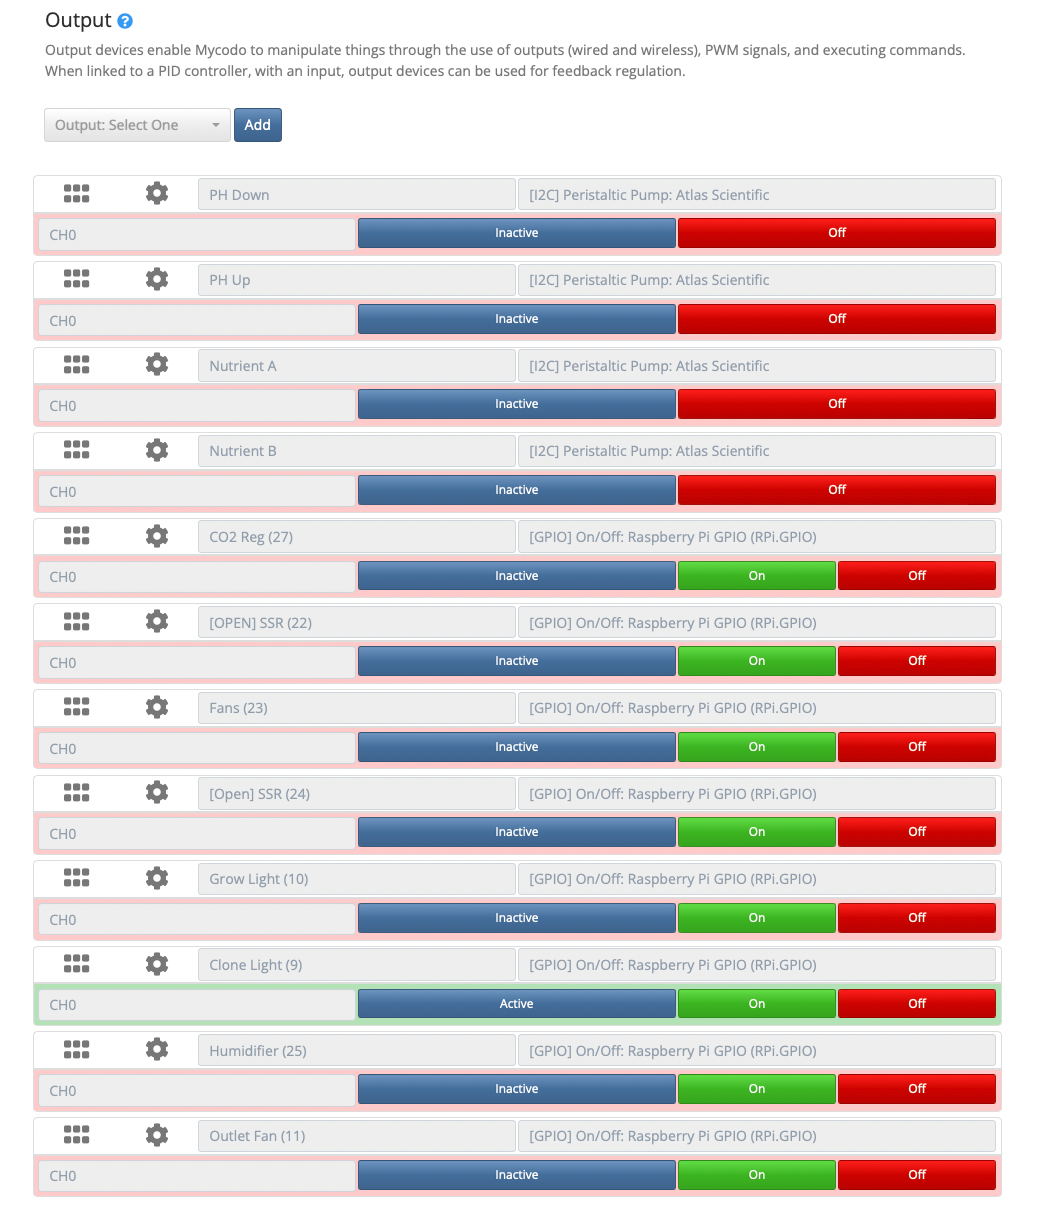
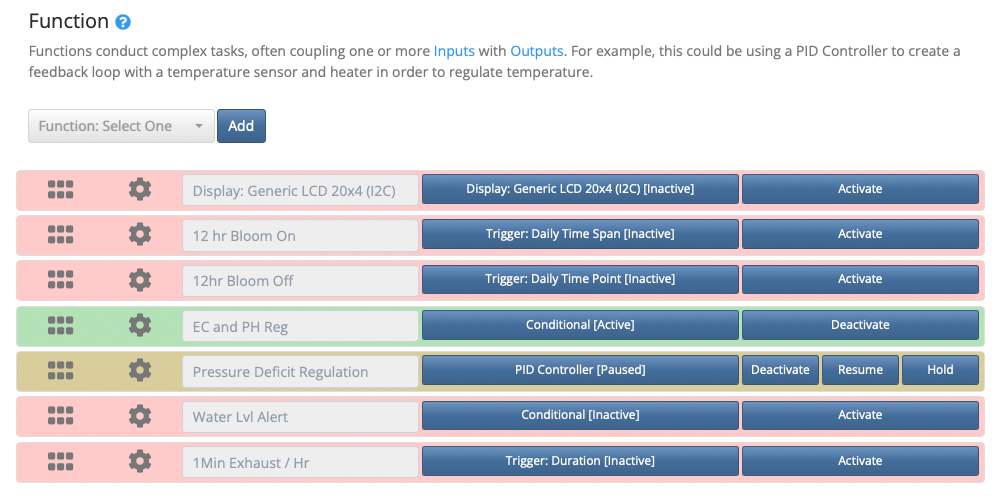
Next I added my outputs. This included the 4 peristaltic pumps and the 8 relays I used in the power control box
I then created functions to take measurements from the inputs and take actions with the outputs. Some functions include the light schedule, EC/PH regulation, and VPD PID controller
Different plants have different optimal environmental levels so for each plant species I create a unique dashboard. I created the dashboard below for a lettuce grow. Learn more about the optimal growth environment here: https://www.austinjbergman.com/optimal-plant-enviroment/
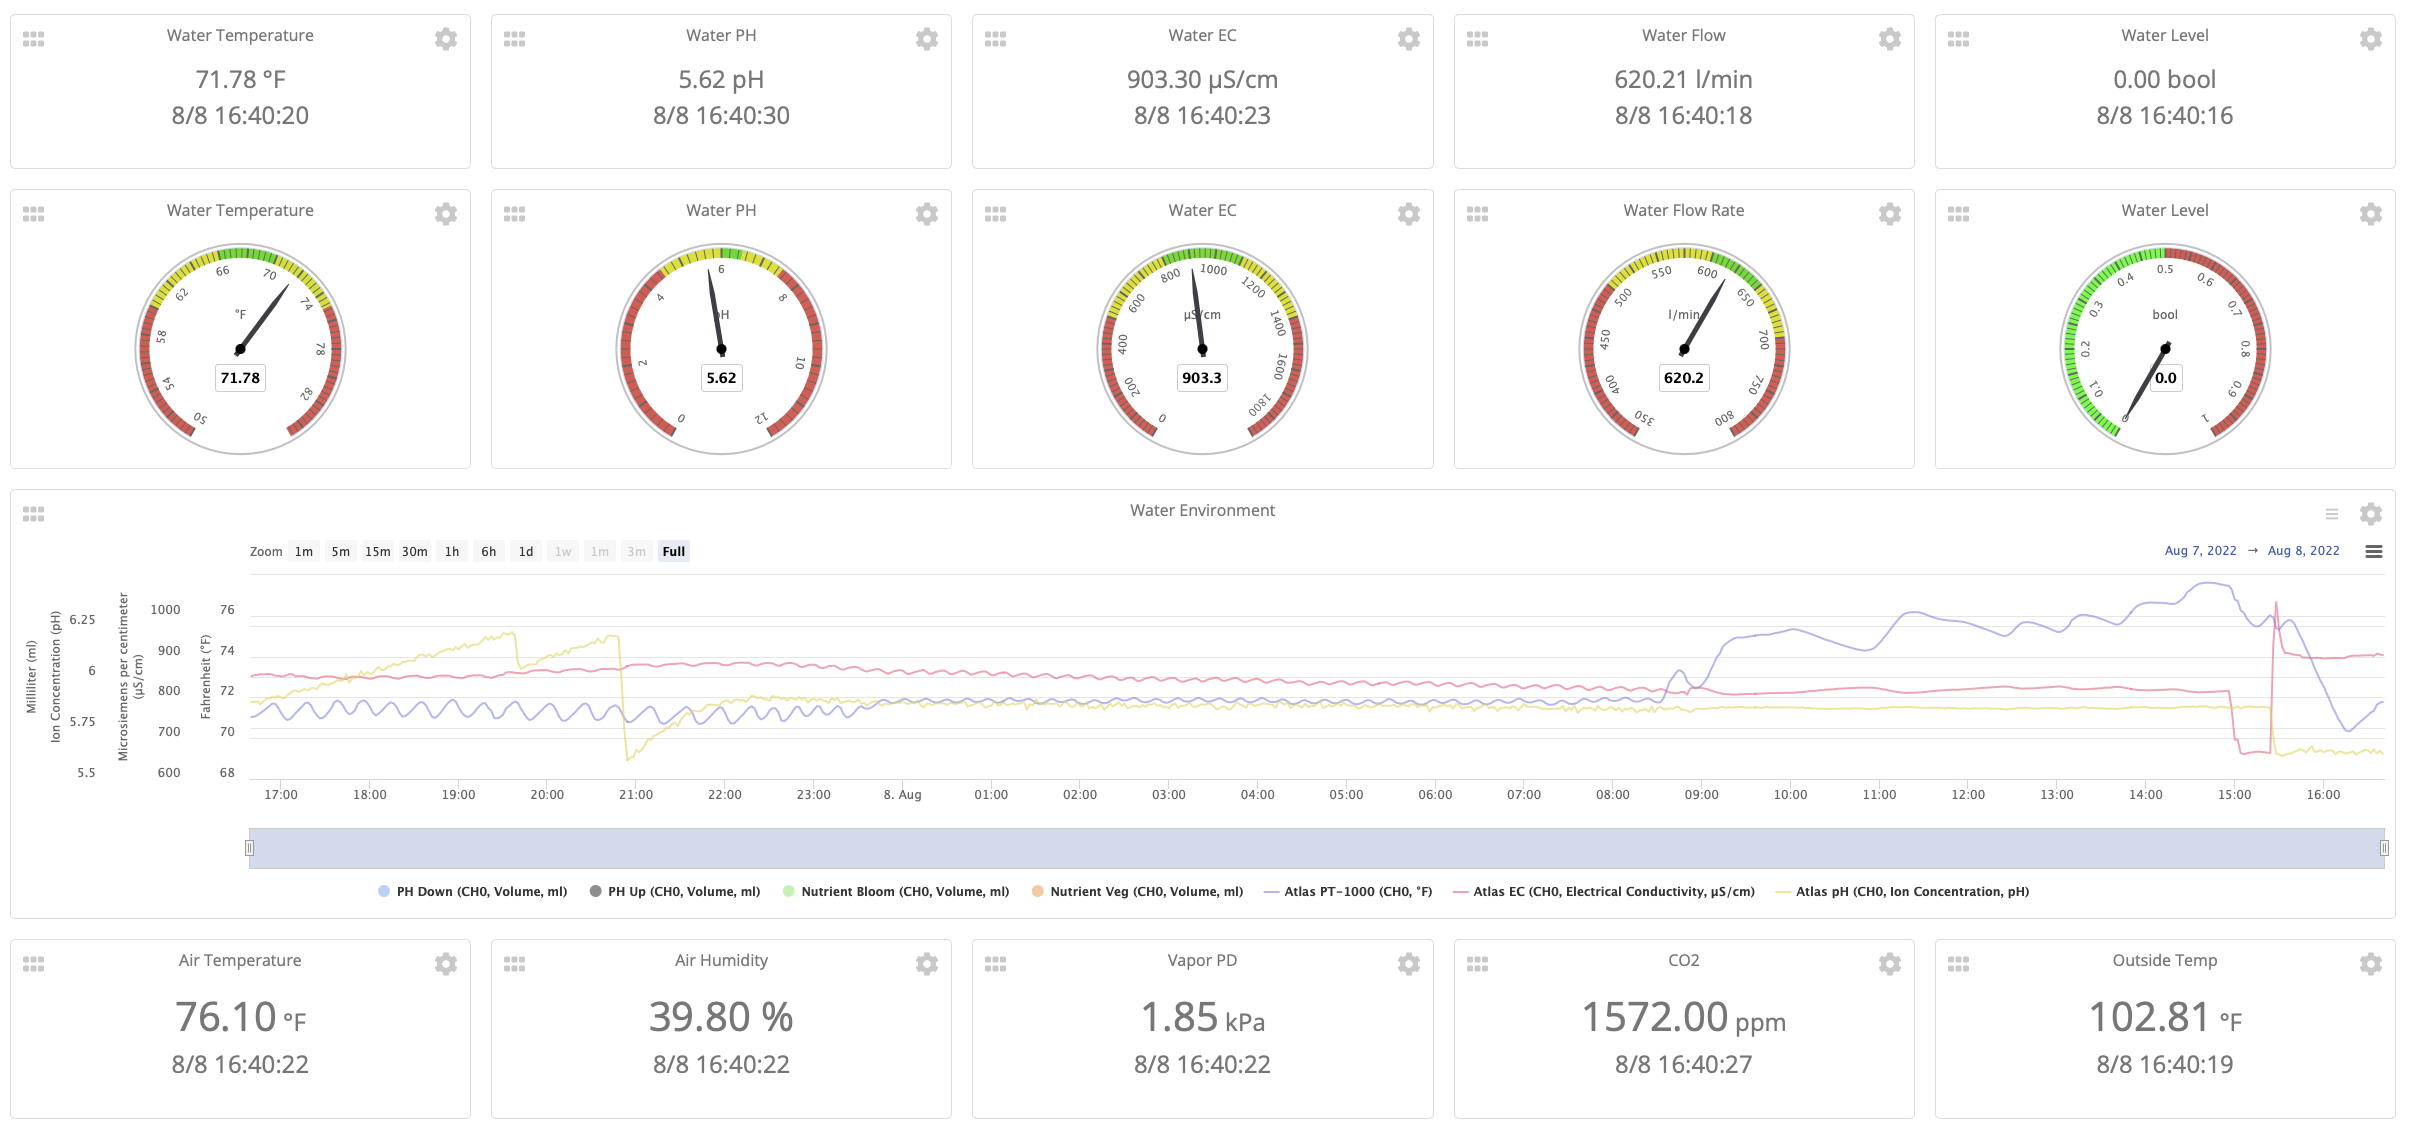
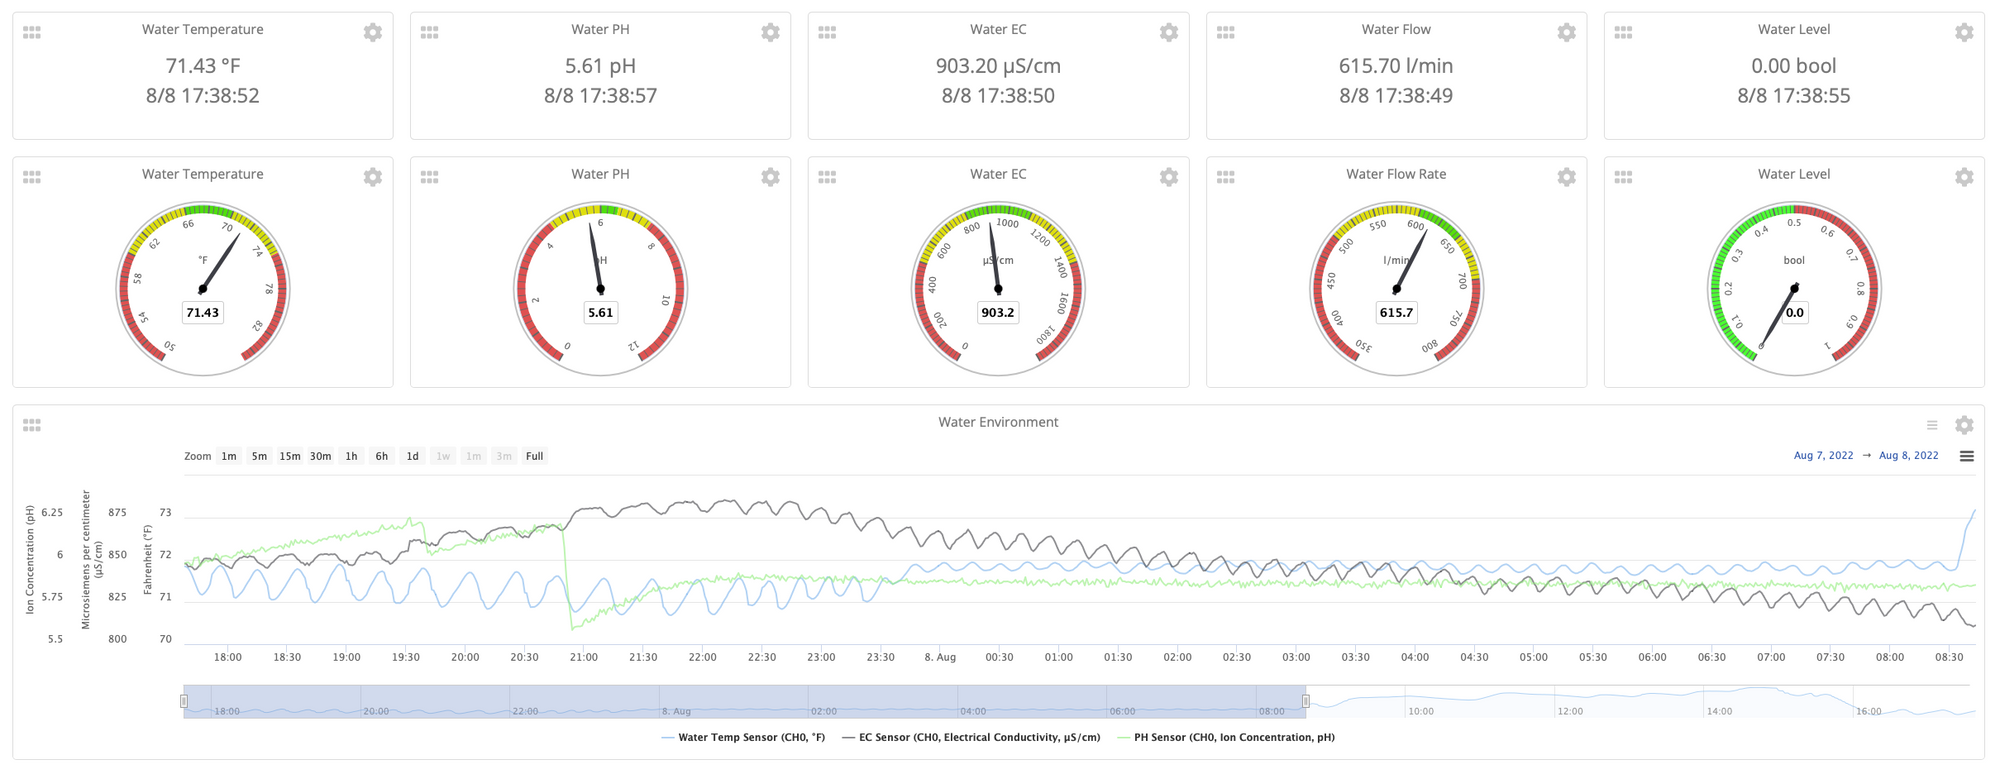
The first section of the dashboard monitors the water environment. Water temperature, PH, EC, flow rate, and level are each represented with a card and a corresponding gauge chart below. Each chart is set with an optimal (Green), satisfactory (Yellow), or dangerous (Red) range and is updated every 15 seconds. Below the gauge charts there is a large synchronous graph plotting the water temperature, EC and PH over time. You can see the data has consistent intervals of up and down showing the control loops are working to keep the measurements in range
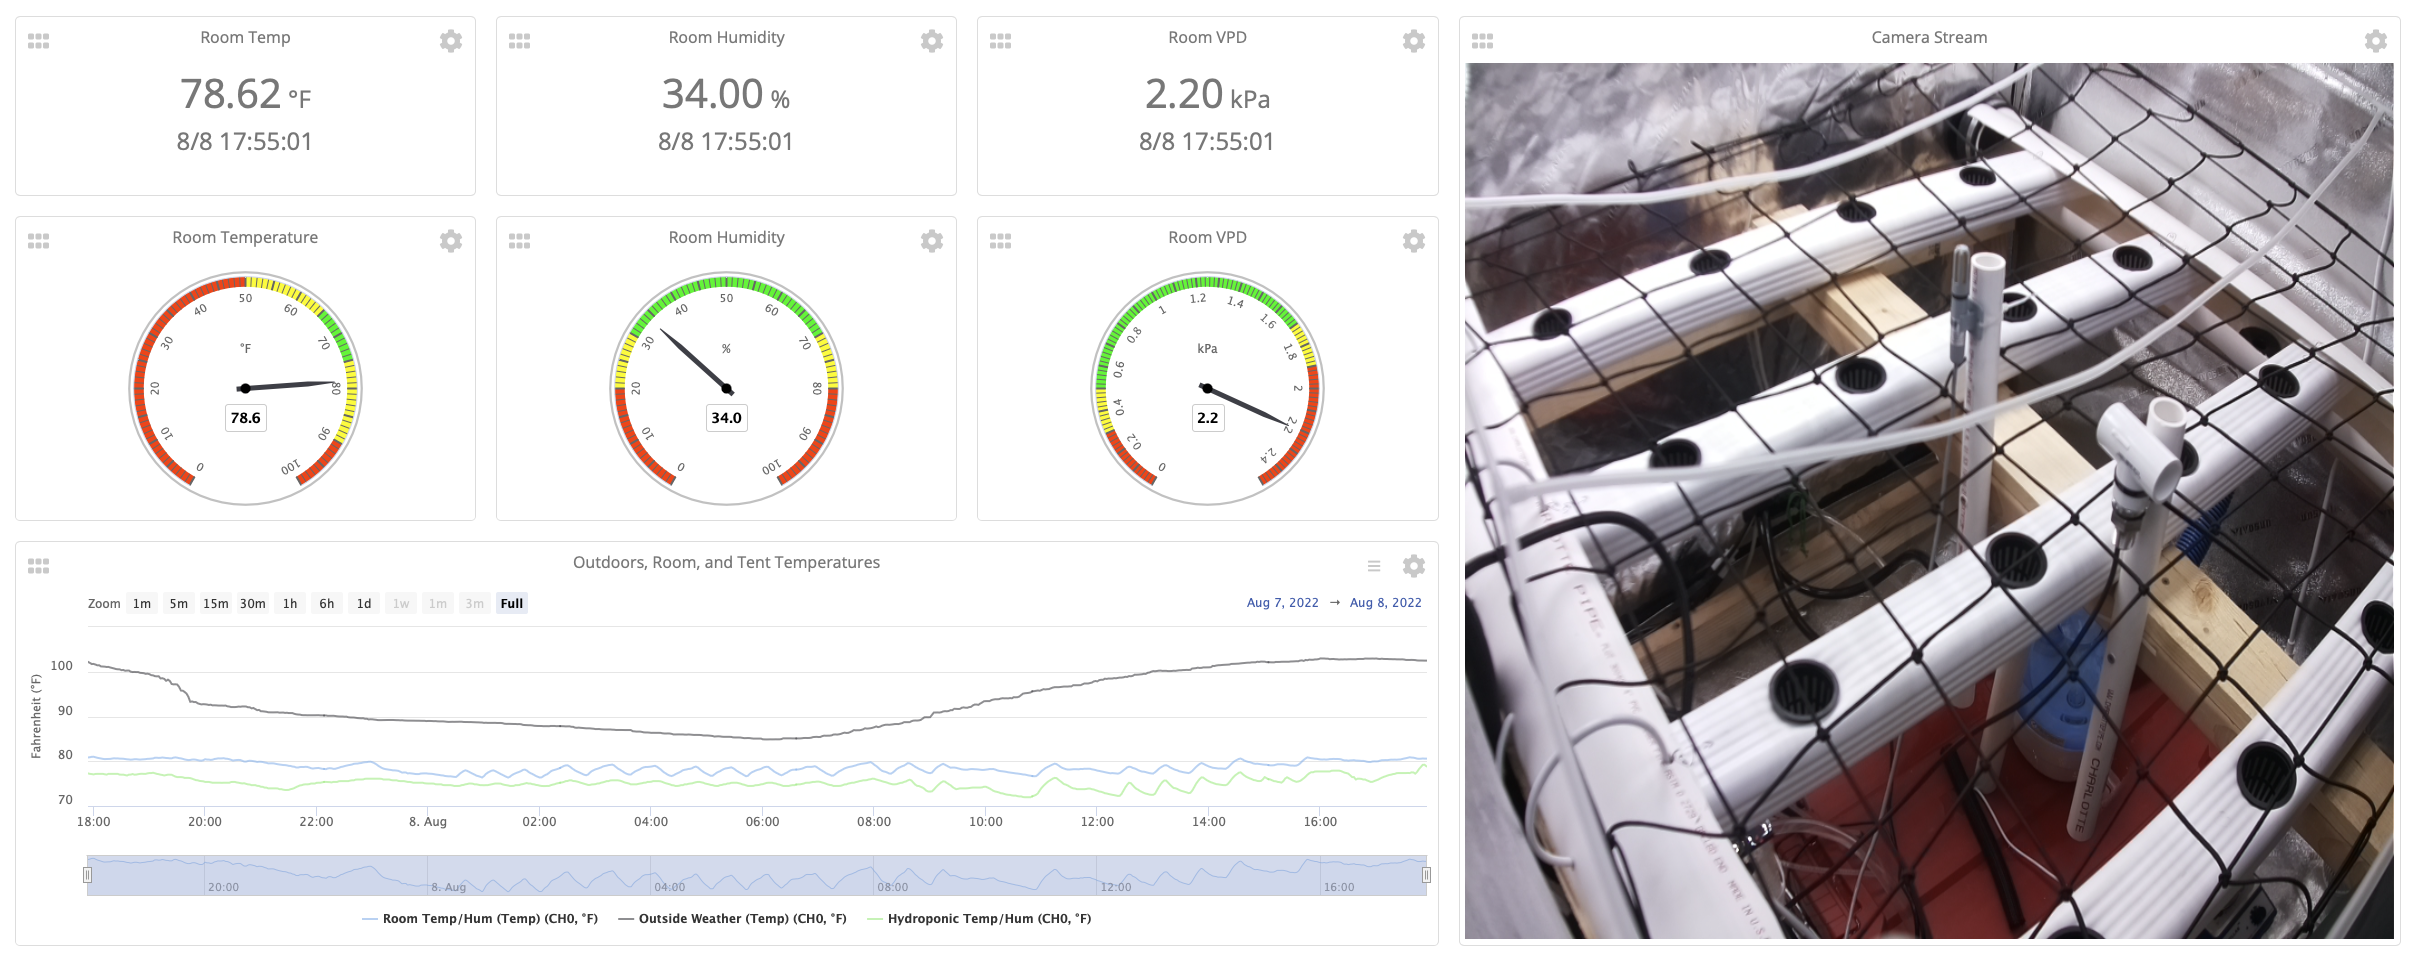
The air environment follows the same format as the water environment, but displays air temperature, humidity, VPD, CO2 concentration, and the outside air temperature. Before this screenshot was taken I had been working on my tent. You can see this in the Air Environment graph below. From 18:00 - 21:30 the humidity(green) was low, VPD(orange) was high, and CO2 levels(blue) periodically spiked. Once I closed the tent at 21:30 you can see the measurements stabilize and return to optimal levels

The third section of visuals is the room environment and camera livestream. The VPD PID controller pulls air in from the room to control the humidity and temperature inside the tent. I'm not using a portable AC or dehumidifier so I'm relying on my room to remain in range to be able to control the tent's air environment
To make sure I don't flip my breaker, I measure the electrical usage with an AC current sensor. The amps being currently drawn is shown on the gauge chart on the left and on the right is electrical usage over time with when each of the functions turn on. This allows you the see the change in consumption for each output
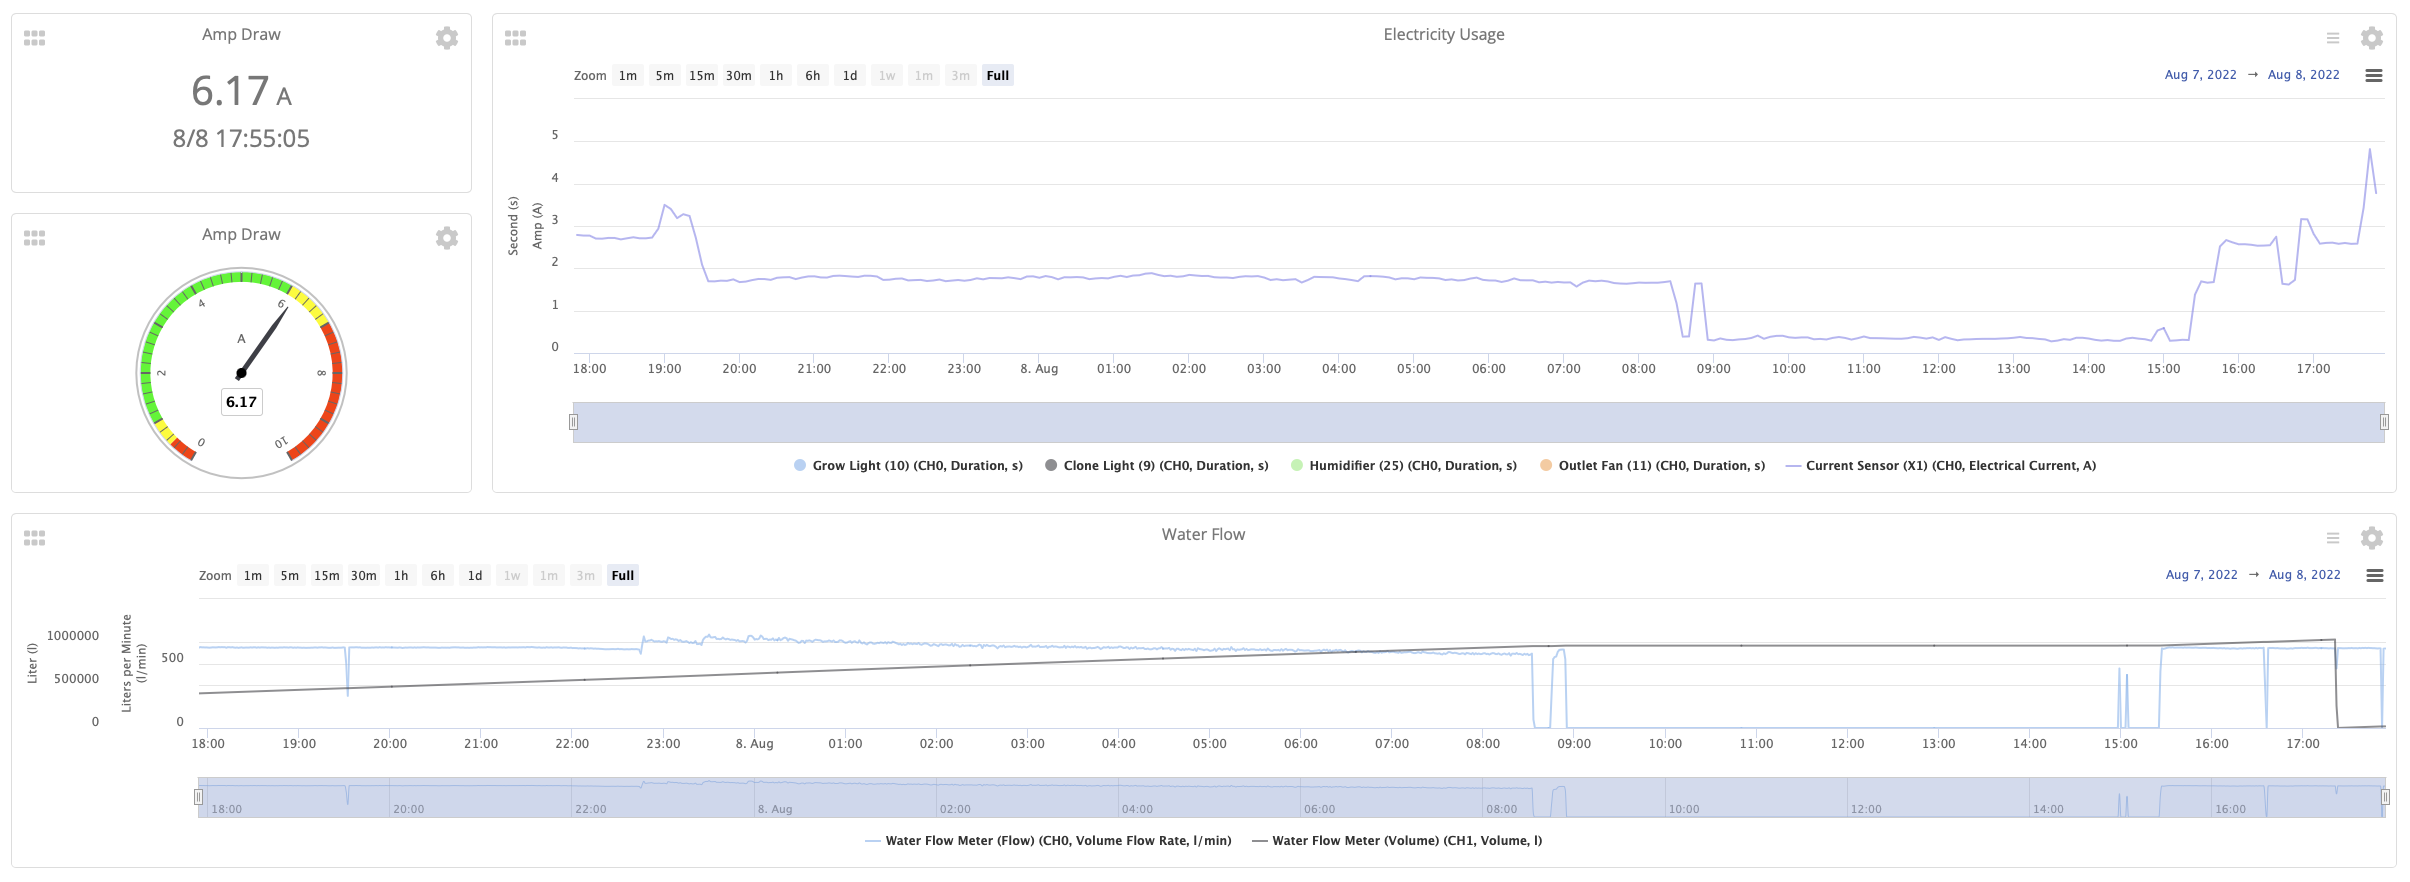
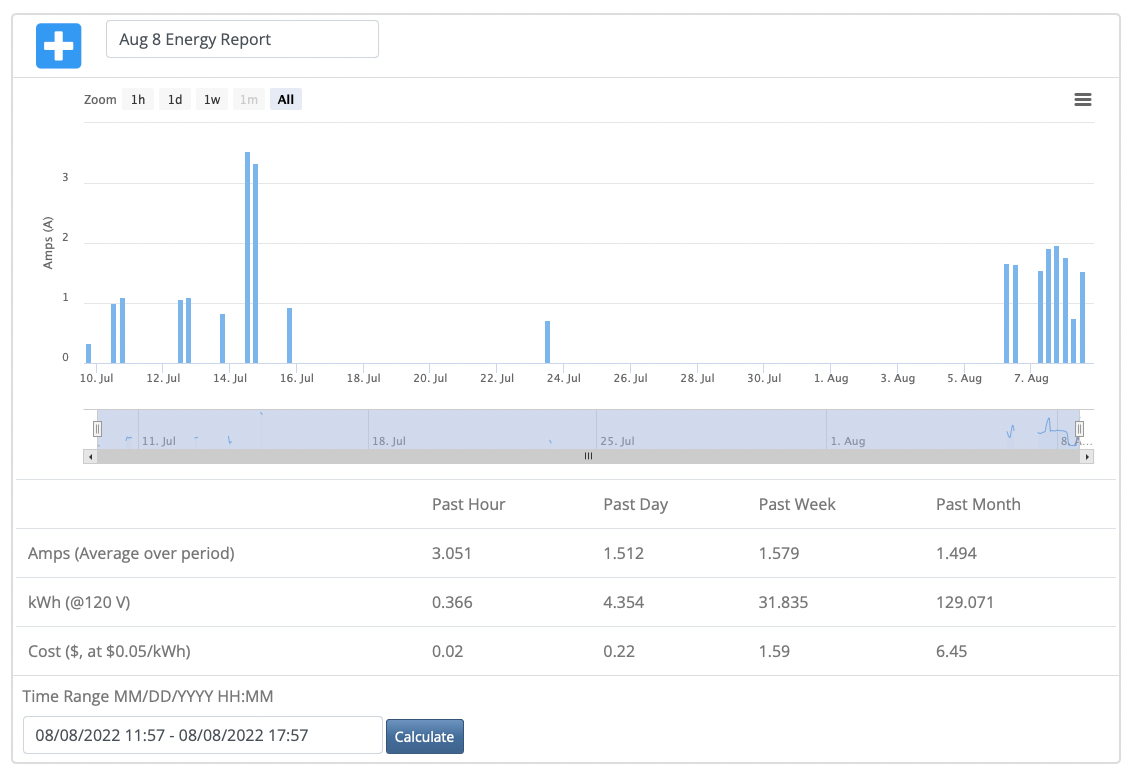
Finally, there is an energy report showing the amps, kWh, and cost over the last hour/ day/ week/ month